Manitoba is one of the most diverse provinces in Canada. It is located in the center of the country, so it features the best qualities of most other regions of Canada. There are unique forests, beautiful skiing locations, and many picturesque lakes. Many tourists come to the province throughout the year, enabling the short-term rentals here to thrive. However, the diverse environment makes the business different in various parts of the province.
Read also:
- The best cities for Airbnb in Quebec
- The best places to buy Airbnb property BC
- TOP-10 cities for Airbnb in Ontario
- Best cities to buy Airbnb in Saskatchewan
- TOP Airbnb cities in Alberta
- Best places to buy Airbnb property in New Brunswick
- Best cities for Airbnb business in NL
- Best places to buy Airbnb property in Prince Edward Island
- Best places to buy Airbnb property in Nova Scotia.
Benefits of Buying an Investment Property in Manitoba
Manitoba, with its growing economy and stable housing market, can be an attractive location for real estate investors. Here are some benefits of buying an investment property in this province:
- Affordable Real Estate: Compared to other Canadian provinces like Ontario and British Columbia, real estate in Manitoba is more affordable. This lower entry cost can enable investors to get a foothold in the property market with a relatively lower capital investment.
- Stable Housing Market: Manitoba has a history of stable and steady growth in real estate values. It hasn’t experienced the extreme fluctuations seen in other markets, which can provide a level of security to investors.
- Diverse Rental Markets: Whether it’s urban centers like Winnipeg or smaller towns, Manitoba has a variety of rental markets. This diversity allows investors to choose from a range of property types and demographic targets.
- High Occupancy Rates: Cities like Winnipeg have high occupancy rates which can assure a steady income for landlords. The demand for rental properties is fueled by a growing population, students, and professionals moving to the city for employment opportunities.
- Economic Growth: With sectors like manufacturing, agriculture, and technology contributing to its economy, Manitoba is on a trajectory of economic growth. This growth can potentially lead to an appreciation in property values over time.
- Favorable Landlord-Tenant Laws: Manitoba has a balanced approach to landlord-tenant legislation which can provide a fair and favorable environment for property owners.
- Growing Population: The province’s population is growing steadily with an influx of immigrants and individuals moving from other parts of Canada for job opportunities. A growing population can lead to increased demand for rental housing.
- Quality of Life: The high quality of life in Manitoba can attract people looking for a better living environment, further driving the demand for rental properties.
Investing in real estate in Manitoba can be a viable option for those looking to diversify their investment portfolio and benefit from the province’s growing economy and stable housing market.
Best Cities for Launching an Airbnb
There are many cities to choose from in Manitoba in terms of an Airbnb investment. There are lots of opportunities available for entrepreneurs: some cities are busy all year round, while other towns offer almost untapped markets with very mild levels of competition. This list will feature the ten most exciting cities in Manitoba. For each location, there will be an overview of the performance of Airbnbs that already operate there.
| City | Revenue, $ |
|---|---|
| Churchill | $5,975 |
| Virden | $2,959 |
| Roblin | $2,822 |
| Winnipeg | $2,200 |
| Lac du Bonnet | $2,103 |
| Dauphin | $1,687 |
| Carberry | $1,626 |
| Selkirk | $1,618 |
| Gimli | $898 |
| Minnedosa | $596 |
Churchill
- Total Available Listings: 15
- Rental Sizes: 1 Bedroom: 75%, 2 Bedroom: 8%, 4 Bedroom: 8%, 5+ Bedroom: 8%
- Listings by Rental Type: Private Room: 75%, Entire Home: 25%
- Average Daily Rate (ADR): $391.4
- Maximum Daily Rate: $782 in March
- Occupancy Rate: 51%
- Maximum Occupancy Rate: 81% in October
- Average Monthly Revenue: $5,975
- Maximum Monthly Revenue: $9,500 in April
- Revenue per Available Room (RevPAR): $199.8
- Weekend Revenue per Available Room (Weekend RevPAR): $439
- Best Month: October
- Market Score: 60
The first city on the list, Churchill, is located in the Northern part of the province of Manitoba. It is a relatively remote place on the shore of Hudson Bay, well-known as the “Polar Bear Capital of the World” due to the many polar bears that move toward the shore from inland in the autumn. While not the most popular tourist destination in Canada, it has been recognized by TIME Magazine as one of the ‘World’s Greatest Places of 2023’ which suggests a notable level of tourist interest and possibly an active development in the tourism sector.
Most visitors come to Churchill to see the polar bears, especially in autumn, and the town has several other attractions as well, making it an amazing destination in the province. The real estate market here is small but seemingly lucrative, with 15 total available listings for rent. The listings are primarily 1-bedroom (75%) and are largely of the type private room (75%), with a smaller percentage being entire home (25%).
The Average Daily Rate (ADR) in Churchill is $391.4, with the rate peaking at $782 in March. The Occupancy Rate averages 51% throughout the year, reaching a maximum of 81% in October, which is also noted as the best month for this market. The average monthly revenue is $5975, but it can go as high as $9,500 in April. The Revenue per Available Room (RevPAR) is $199.8, and it increases to $439 over the weekends.
Despite the seasonal nature of the business and the small market size, the properties in Churchill do not seem to have issues with occupation, especially during the high-demand seasons. The market score stands at 60, indicating a moderate level of market profitability and potential for investors. This data suggests that although the market is small, it has the potential for aspiring entrepreneurs, especially those interested in seasonal and tourism-driven business opportunities.
Gimli
- Total Available Listings: 127
- Rental Sizes: 1 Bedroom: 9%, 2 Bedroom: 28%, 3 Bedroom: 43%, 4 Bedroom: 16%, 5+ Bedroom: 4%
- Listings by Rental Type: Private Room: 2%, Entire Home: 98%
- Average Daily Rate (ADR): $254.8
- Maximum Daily Rate: $267 in December
- Occupancy Rate: 52%
- Maximum Occupancy Rate: 80% in July
- Average Monthly Revenue: $2,959
- Maximum Monthly Revenue: $5,100 in July
- Revenue per Available Room (RevPAR): $137.6
- Weekend Revenue per Available Room (Weekend RevPAR): $237
- Best Month: July
- Market Score: 42
Gimli, situated to the north of Winnipeg, boasts a scenic shoreline along a renowned lake, making it a seasonal hotspot especially during the summer months. Unlike the previously mentioned towns, Gimli has a relatively larger number of listings, yet the competition remains moderate.
The total number of active listings in Gimli stands at 127, with a dominating 98% being entire homes. These homes vary in size, with the most common being 3-bedroom rentals (43%), followed by 2-bedroom (28%), 4-bedroom (16%), 1-bedroom (9%), and 5+ bedroom (4%) rentals.
The Average Daily Rate (ADR) in Gimli has risen to $254.8, with the rate peaking at $267 in December. Gimli sees an average Occupancy Rate of 52%, which surges to a high of 80% in July, making it the best month for rentals in this region. Despite the dip in demand during the winter, the buoyancy of the hot season keeps local rentals sustainable. The Revenue per Available Room (RevPAR) stands at $137.6, with a higher Weekend RevPAR of $237, indicating a preference for weekend getaways among visitors.
On average, a rental property in Gimli could generate a revenue of $2,959 per month, with the figure escalating to a substantial $5,100 in July. The market score of 42 suggests a moderate level of market attractiveness and potential for profitability, especially for those considering listing entire homes. Interestingly, the market for private room listings is almost non-existent, constituting only 2% of the total listings. This presents a unique, albeit niche, opportunity for entrepreneurs looking to offer private room listings, as there’s virtually no competition in this segment.
With the majority of rentals being scattered along the shore, Gimli provides a promising locale for new entire home listings. The sparse competition coupled with the seasonal influx of visitors creates a conducive environment for aspiring entrepreneurs to enter the market, particularly with entire home listings.
Virden
- Total Available Listings: 2
- Rental Sizes: 1 Bedroom: 50%, 2 Bedroom: 50%
- Listings by Rental Type: Private Room: 100%
- Average Daily Rate (ADR): $74.3
- Maximum Daily Rate: $77 in February-March
- Occupancy Rate: 52%
- Maximum Occupancy Rate: 76% in August
- Average Monthly Revenue: $898
- Maximum Monthly Revenue: $1,900 in May
- Revenue per Available Room (RevPAR): $39.9
- Weekend Revenue per Available Room (Weekend RevPAR): $70.6
- Best Month: August
Virden, situated centrally within the province, presents a budding market for entrepreneurs eyeing less saturated locales. Although the town has its airport facilitating tourist access, the short-term rental industry is in its infancy. Currently, there are only two listings available, both of which are private rooms.
The Average Daily Rate (ADR) in Virden is standing at $74.3, with a slight peak of $77 during February and March. The annual Occupancy Rate averages at 52%, reaching a maximum of 76% in August, indicating a demand particularly during the summer. The average monthly revenue is $898, which may not be as lucrative as other regions but shows potential, especially in May when the revenue can hike up to $1,900.
Both available listings are 1 and 2-bedroom private rooms, each constituting 50% of the total listings. The Revenue per Available Room (RevPAR) is $39.9, with a higher Weekend RevPAR of $70.6, suggesting a better performance over weekends.
While the market score of 0 suggests a low level of market attractiveness, the absence of entire home listings could present an untapped opportunity for entrepreneurs. Launching an entire home rental could create a new segment within the market, potentially attracting a different clientele and establishing a unique selling proposition. Similarly, although there are already two private room listings, the low competition level may still offer room for new entrants to make their mark. The relatively high Occupancy Rate during summer also hints at a seasonal demand that could be further exploited to enhance the market’s profitability.
Roblin
- Total Available Listings: 9
- Rental Sizes: 2 Bedroom: 80%, 4 Bedroom: 20%
- Listings by Rental Type: Entire Home: 100%
- Average Daily Rate (ADR): $151.8
- Maximum Daily Rate: $166 in September
- Occupancy Rate: 67%
- Maximum Occupancy Rate: 89% in June
- Average Monthly Revenue: $2,822
- Maximum Monthly Revenue: $3,400 in June, August
- Revenue per Available Room (RevPAR): $103.4
- Weekend Revenue per Available Room (Weekend RevPAR): $144
- Best Month: June
- Market Score: 29
Roblin, like the previous town, is situated in the western part of the province and boasts its own airport, enhancing accessibility for visitors. The town is surrounded by several lakes, and the locally renowned campground is a significant draw for visitors. Unlike Virden, Roblin has nine properties actively listed for rent, all of which are entire homes.
These homes predominantly have 2 bedrooms (80%), with a smaller portion having 4 bedrooms (20%), catering to varying group sizes. The Average Daily Rate (ADR) in Roblin is $151.8, with a peak rate of $166 witnessed in September. Despite the relatively low competition, the market is thriving with an Occupancy Rate of 67% on average, which rises to an impressive 89% in June, marking it as the best month for rentals in this region.
Local hosts in Roblin have adopted a strategy of setting competitive rates, contrary to leveraging the low supply to charge higher prices. This strategy seems to have paid off in maintaining good occupancy rates, especially during the peak season. The average monthly revenue stands at $2,822, with the potential to reach $3,400 in both June and August. The Revenue per Available Room (RevPAR) averages at $103.4, with a higher Weekend RevPAR of $144, indicating better performance during the weekends.
The market score of 29 suggests a moderate level of market attractiveness, showing promise for potential investors, especially with a 100% entire home listing scenario. This unique market structure coupled with the scenic allure of Roblin and its camping facilities presents a potential opportunity for entrepreneurs to tap into the growing short-term rental market in the town.
Selkirk
- Total Available Listings: 3
- Rental Sizes: 1 Bedroom: 75%, 3 Bedroom: 25%
- Listings by Rental Type: Private Room: 50%, Entire Home: 50%
- Average Daily Rate (ADR): $107.5
- Maximum Daily Rate: $116 in September
- Occupancy Rate: 54%
- Maximum Occupancy Rate: 81% in December
- Average Monthly Revenue: $1,618
- Maximum Monthly Revenue: $2,700 in December
- Revenue per Available Room (RevPAR): $60
- Weekend Revenue per Available Room (Weekend RevPAR): $104
- Best Month: December
- Market Score: 66
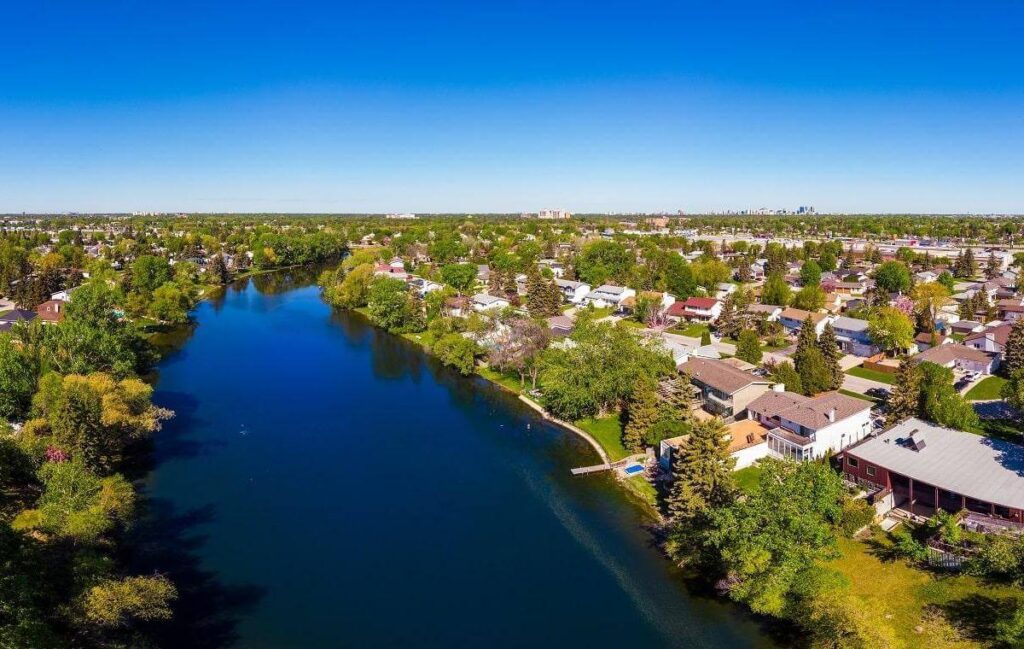
Selkirk is a quaint town situated North-East of Winnipeg, nestled between the city and a nearby lake. The Airbnb market in Selkirk presents a fairly uncompetitive landscape with ample potential for growth. As of now, there are three available listings in the area, evenly split between private room and entire home offerings.
The Average Daily Rate (ADR) in Selkirk is $107.5, peaking at $116 in September. Unlike some of the previously discussed towns, Selkirk enjoys a less seasonal demand, with an Occupancy Rate averaging at 54% over the year. However, this rate escalates to a substantial 81% in December, marking it as the best month for rentals in this area.
The rental sizes vary between 1 bedroom (75%) and 3 bedrooms (25%), catering to different guest needs. The balanced mix of private room and entire home listings offers diverse options for visitors, potentially attracting a broader customer base.
On average, a property in Selkirk could generate a monthly revenue of $1,618, with the potential to surge to $2,700 in December. The Revenue per Available Room (RevPAR) stands at $60, with a higher Weekend RevPAR of $104, indicating a notable uptick in weekend occupancy and revenue generation.
The proximity to Winnipeg, a larger urban center, could be advantageous for Selkirk’s Airbnb market. As tourism in Winnipeg thrives, the spillover effect could lead to an increase in the number of visitors preferring to stay in nearby towns like Selkirk. The market score of 66 reflects a promising level of market attractiveness and potential profitability for aspiring investors looking to venture into the short-term rental market in Selkirk.
Minnedosa
- Total Available Listings: 7
- Rental Sizes: 1 Bedroom: 88%, 2 Bedroom: 12%
- Listings by Rental Type: Private Room: 67%, Entire Home: 33%
- Average Daily Rate (ADR): $128.5
- Maximum Daily Rate: $156 in November
- Occupancy Rate: 24%
- Maximum Occupancy Rate: 47% in August
- Average Monthly Revenue: $596
- Maximum Monthly Revenue: $1,500 in August
- Revenue per Available Room (RevPAR): $34.3
- Weekend Revenue per Available Room (Weekend RevPAR): $141
- Best Month: August
- Market Score: 66
Minnedosa is a smaller town located to the West of Winnipeg. It’s a bit farther from the urban hub compared to other towns on the list, yet it holds unique appeal. The town is known for its beach resort which attracts a fair number of tourists during the summer. Moreover, Minnedosa has its own airport, making it relatively accessible for visitors.
Currently, there are seven active listings in Minnedosa, a mix of private rooms and entire home listings. Specifically, 67% of the listings are private rooms, and 33% are entire homes. This distribution presents an opportunity for investors, especially those interested in listing entire homes, though there is already a small presence in this segment.
The Average Daily Rate (ADR) in Minnedosa is $128.5, with a notable peak rate of $156 in November. The Occupancy Rate here averages at 24%, with a significant uptick to 47% in August, marking it as the best month for rentals in this area. The low Occupancy Rate could be a point of concern, yet the peak during summer suggests a seasonal demand that can be capitalized on.
The rental sizes are predominantly 1-bedroom units (88%), with a smaller portion being 2-bedroom units (12%).
On an average, properties in Minnedosa can generate a monthly revenue of $596, with a potential to escalate to $1,500 in August. The Revenue per Available Room (RevPAR) is $34.3, but it significantly increases to $141 over weekends, indicating a preference for weekend stays among visitors.
With a Market Score of 66, Minnedosa holds a moderate level of market attractiveness. The proximity to a beach resort, coupled with the seasonal demand, presents a potential opportunity for investors to tap into, especially during the summer months. However, the low Occupancy Rate and the small number of listings suggest a market that is still in its nascent stages, requiring a well-thought-out strategy for those looking to enter.
Lac du Bonnet
- Total Available Listings: 4
- Rental Sizes: 2 Bedroom: 100%
- Listings by Rental Type: Entire Home: 100%
- Average Daily Rate (ADR): $248.8
- Maximum Daily Rate: $312 in December
- Occupancy Rate: 49%
- Maximum Occupancy Rate: 98% in July
- Average Monthly Revenue: $2,103
- Maximum Monthly Revenue: $4,200 in May
- Revenue per Available Room (RevPAR): $143.2
- Weekend Revenue per Available Room (Weekend RevPAR): $225
- Best Month: July
Lac du Bonnet is a relatively secluded locale in the province, its primary attraction being the serene lake after which the city is named. The proximity of an airport undoubtedly facilitates a higher influx of visitors to this picturesque region. While the market has been somewhat stagnant, there’s anticipation among investors for growth, parallel to the ongoing development in Lac du Bonnet.
Currently, there are four active listings within the city, all of which are entire homes. These listings are 2-bedroom homes, catering to visitors who seek a comfortable stay. The Average Daily Rate (ADR) now stands at $248.8, peaking at $312 in December. The Occupancy Rate averages at 49% over the year, skyrocketing to a remarkable 98% in July, reflecting the seasonal appeal of this area.
The monthly revenue generated by these rentals averages at $2,103, with a significant leap to $4,200 in May. The Revenue per Available Room (RevPAR) is $143.2, and sees an uptick to $225 over the weekends, indicating the area’s popularity for weekend getaways.
July, with its near-full occupancy, stands out as the best month for Airbnb rentals in Lac du Bonnet, likely due to the summer allure of the lake and the surrounding natural beauty.
Lac du Bonnet, with its tranquil ambiance and lack of intense competition, presents a promising venture for entrepreneurs. The success in this market would largely hinge on the quality of the accommodation and the hospitality extended by the host. With the right strategy, this calm and captivating area could unfold into a thriving Airbnb market, capitalizing on the visitors drawn to the lake and the natural beauty of Lac du Bonnet.
Carberry
- Total Available Listings: 1
- Rental Sizes: 1 Bedroom: 100%
- Listings by Rental Type: Entire Home: 100%
- Average Daily Rate (ADR): $148.4
- Maximum Daily Rate: $168 in September
- Occupancy Rate: 40%
- Maximum Occupancy Rate: 62% in August
- Average Monthly Revenue: $1,626
- Maximum Monthly Revenue: $2,500 in August
- Revenue per Available Room (RevPAR): $60
- Weekend Revenue per Available Room (Weekend RevPAR): $135
- Best Month: August
Carberry is among the smaller and more remote towns discussed today, and currently hosts just one listing on Airbnb. While the limited data restricts comprehensive analysis and projections, the lack of competition in Carberry could present a promising opportunity for small business ventures in the short-term rental market.
The solitary listing in Carberry is an entire home with one bedroom, representing the entire Airbnb market in the town at the moment. Despite the small scale, the metrics from this listing are noteworthy. The Average Daily Rate (ADR) is $148.4, with a peak rate of $168 in September. The Occupancy Rate averages at 40% over the year, but experiences a significant increase to 62% in August, marking it as the best month for rentals in this area.
On average, the property generates a monthly revenue of $1,626, with the potential to climb to $2,500 in August, which is indicative of the seasonal appeal Carberry holds. The Revenue per Available Room (RevPAR) stands at $60, which escalates to $135 over the weekends, reflecting a higher demand during weekends possibly due to short getaways by visitors.
In conclusion, Carberry, with its tranquil and remote setting, could be a favorable choice for individuals or small enterprises looking to delve into a market with virtually no competition. The performance of the existing listing suggests that with effective marketing, especially targeting the summer months, there could be a substantial opportunity for growth and profitability in Carberry’s Airbnb market.
Winnipeg
- Total Available Listings: 1,562
- Rental Sizes: 1 Bedroom: 48%, 2 Bedroom: 33%, 3 Bedroom: 13%, 4 Bedroom: 5%, 5+ Bedroom: 1%
- Listings by Rental Type: Private Room: 25%, Entire Home: 75%
- Average Daily Rate (ADR): $131.2
- Maximum Daily Rate: $138 in July-August
- Occupancy Rate: 58%
- Maximum Occupancy Rate: 74% in July
- Average Monthly Revenue: $1,693
- Maximum Monthly Revenue: $2,200 in July
- Revenue per Available Room (RevPAR): $78.6
- Weekend Revenue per Available Room (Weekend RevPAR): $129
- Best Month: July
- Market Score: 75
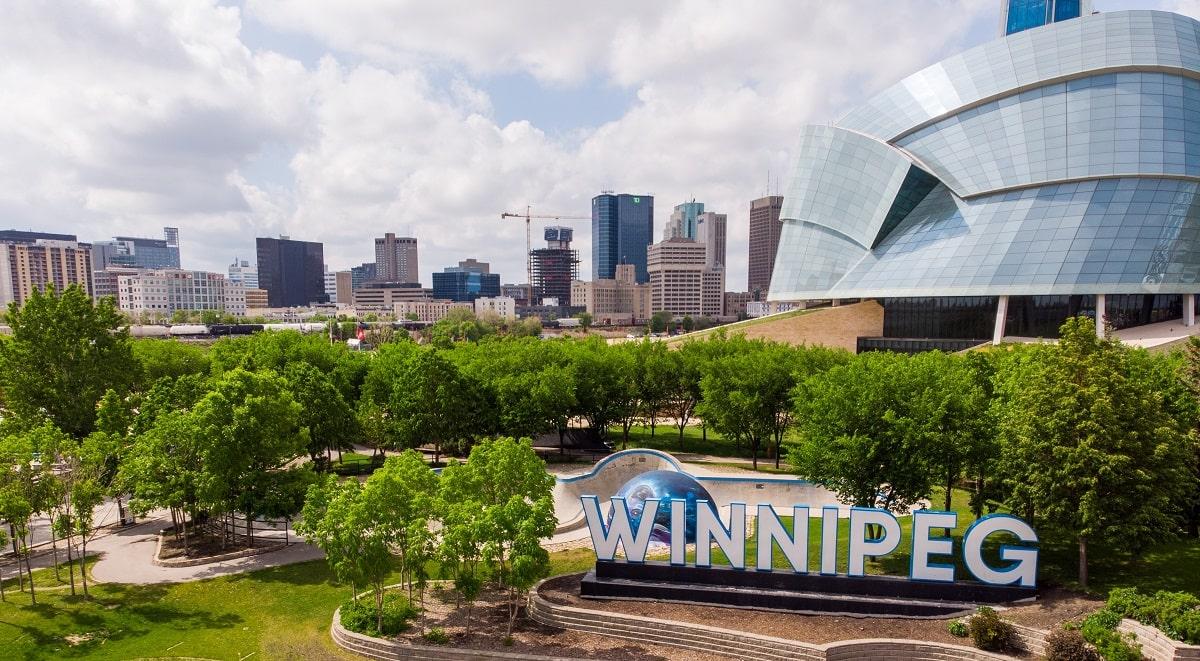
Winnipeg, being the largest city in the province and its capital, naturally has the most substantial short-term rental market in the area. As the seventh largest city in Canada, Winnipeg attracts a significant number of visitors, thereby fostering a competitive but stable short-term rental market.
Currently, there are about 1,562 active rentals in Winnipeg, a noticeable increase from the previously mentioned 1,400. Among these listings, 75% are entire homes while 25% are private rooms. The rental sizes vary, with a predominant number of 1-bedroom (48%) and 2-bedroom (33%) units, followed by 3-bedroom (13%), 4-bedroom (5%), and 5+ bedroom (1%) listings.
The Average Daily Rate (ADR) in Winnipeg has seen an increase to $131.2, with a slight peak of $138 during the months of July and August. The Occupancy Rate averages at 58% over the year, with a notable uptick to 74% in July, making it the best month for rentals in this city.
On average, properties in Winnipeg generate a monthly revenue of $1,693, with the potential to climb to $2,200 in July. The Revenue per Available Room (RevPAR) is $78.6, and it rises to $129 over the weekends, indicating a higher demand for weekend stays.
With a Market Score of 75, Winnipeg presents a relatively lower-risk investment opportunity in the province, despite the intense competition. The stable business environment, coupled with the city’s stature and appeal, makes Winnipeg a viable choice for investors looking to venture into the short-term rental market.
Dauphin
- Total Available Listings: 14
- Rental Sizes: 1 Bedroom: 59%, 2 Bedroom: 29%, 3 Bedroom: 6%, 4 Bedroom: 6%
- Listings by Rental Type: Private Room: 35%, Entire Home: 65%
- Average Daily Rate (ADR): $141.6
- Maximum Daily Rate: $154 in March
- Occupancy Rate: 47%
- Maximum Occupancy Rate: 62% in July
- Average Monthly Revenue: $1,687
- Maximum Monthly Revenue: $2,300 in July
- Revenue per Available Room (RevPAR): $70
- Weekend Revenue per Available Room (Weekend RevPAR): $141
- Best Month: August
- Market Score: 78
Dauphin, akin to other destinations mentioned, is a quaint town with a budding short-term rental market. Nestled near the renowned Dauphin Lake, the town is situated around 15 kilometers from the beach, offering a residential ambiance enriched with various inns, cafes, and restaurants. Currently, there are 14 properties actively listed for rent in Dauphin, of which 65% are entire homes.
The Average Daily Rate (ADR) in Dauphin stands at $141.6, with a peak rate of $154 observed in March. The annual average Occupancy Rate is 47%, which sees a notable increase to 62% in July, showcasing the summer appeal of this locale. Despite July’s high occupancy, August emerges as the best month for rentals in this town.
The monthly revenue generated by properties in Dauphin averages at $1,687, with a surge to $2,300 in July, reflecting the town’s seasonal allure. The Revenue per Available Room (RevPAR) is calculated at $70, which rises significantly to $141 over the weekends, indicating a higher demand for weekend stays.
With a Market Score of 78, Dauphin presents a conducive and relatively competitive environment for both private room and entire home listings. The mild competition and stable setting make Dauphin a viable choice for investors looking to explore the short-term rental market.